Loyalty program metrics
The 12 numbers every loyalty-program operator should track — formulas and calculated examples.
Loyalty programLast verified 2026-09-22Updated
These 12 metrics are mechanical — they have specific formulas that any operator can run from their own data. We publish the formulas; the industry ranges are illustrative ranges from public operator reports and prior industry research, not a verified benchmark study. Use them as a sanity check, not a goal.
| Metric | What it measures | How to calculate | Industry range |
|---|---|---|---|
| Active members | Program members who transacted within a defined window (30/60/90 days). | Members with ≥1 transaction in last N days ÷ total members × 100 | 20–60% of signup base, varies widely. |
| Join rate | New program sign-ups per week, normalized by traffic. | New sign-ups ÷ unique customer count × 100 | 5–15% of unique monthly customers within launch quarter. |
| Redemption rate | Share of issued rewards that actually get redeemed. | Rewards redeemed ÷ rewards issued × 100 | 60–80% for stamps; 30–60% for app-based programs. |
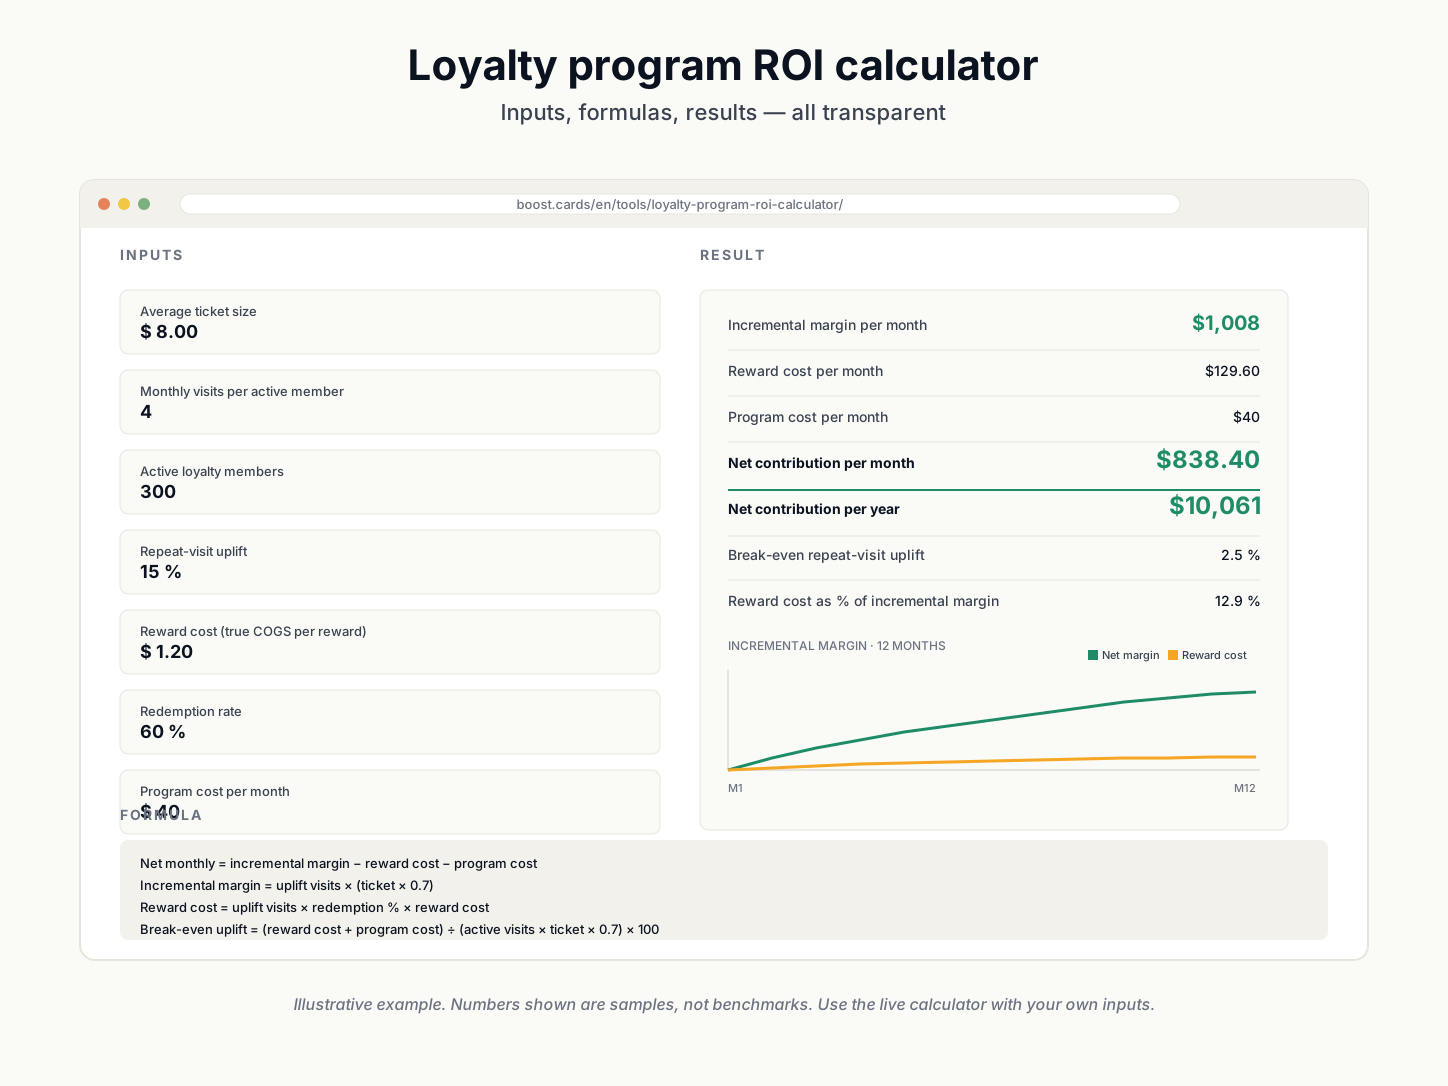
| Repeat-visit uplift | Incremental repeat-visit frequency among active members vs non-members. | (Active member visit rate − baseline) ÷ baseline × 100 | +12 to +25%. |
| Reward cost as % of cumulative spend | Reward's true cost divided by cumulative spend required to earn it. | (Reward cost) ÷ (cumulative spend) × 100 | 6–10% is healthy. |
| Reward cost as % of revenue | Total reward cost across active members divided by revenue from those members. | Σ rewards × true cost ÷ revenue from active members × 100 | 2–5% for stamps; 4–8% for points. |
| Incremental CLV lift | Change in customer lifetime value attributable to the program. | ΔCLV (active members − baseline) over program tenure | Varies; report per-cohort for accurate read. |
| Program operating cost | Sum of platform fees + staff time + reward cost. | Direct program costs attributable to month | Compare to incremental margin; program should net positive. |
| Participation rate | Share of customers who are program members. | Members ÷ unique customer count × 100 | 40–70% within 12 months of launch is realistic for well-run programs. |
| Email engagement among members | Open and click-through rates of program-targeted email. | Standard ESP reporting per campaign and segment | Open 25–40%; CTR 3–8% for well-targeted program mail. |
| Wallet-pass installs | Number of customers who saved the pass to their wallet. | Installs ÷ unique customer count × 100 | 5–20% within 6 months of launch. |
| NPS delta (members vs non-members) | Difference in Net Promoter Score between members and non-members. | NPS(members) − NPS(non-members) | Members typically score 10–30 points higher. |
All metrics are mechanical, not statistical. We publish the formulas; the industry ranges are illustrative ranges drawn from public operator reports and not a verified benchmark study.